Data displays
datasetBrowser
function datasetBrowser(
  dataset: Dataset<InputType, string>,
  options: {
    batchSize: number;
  },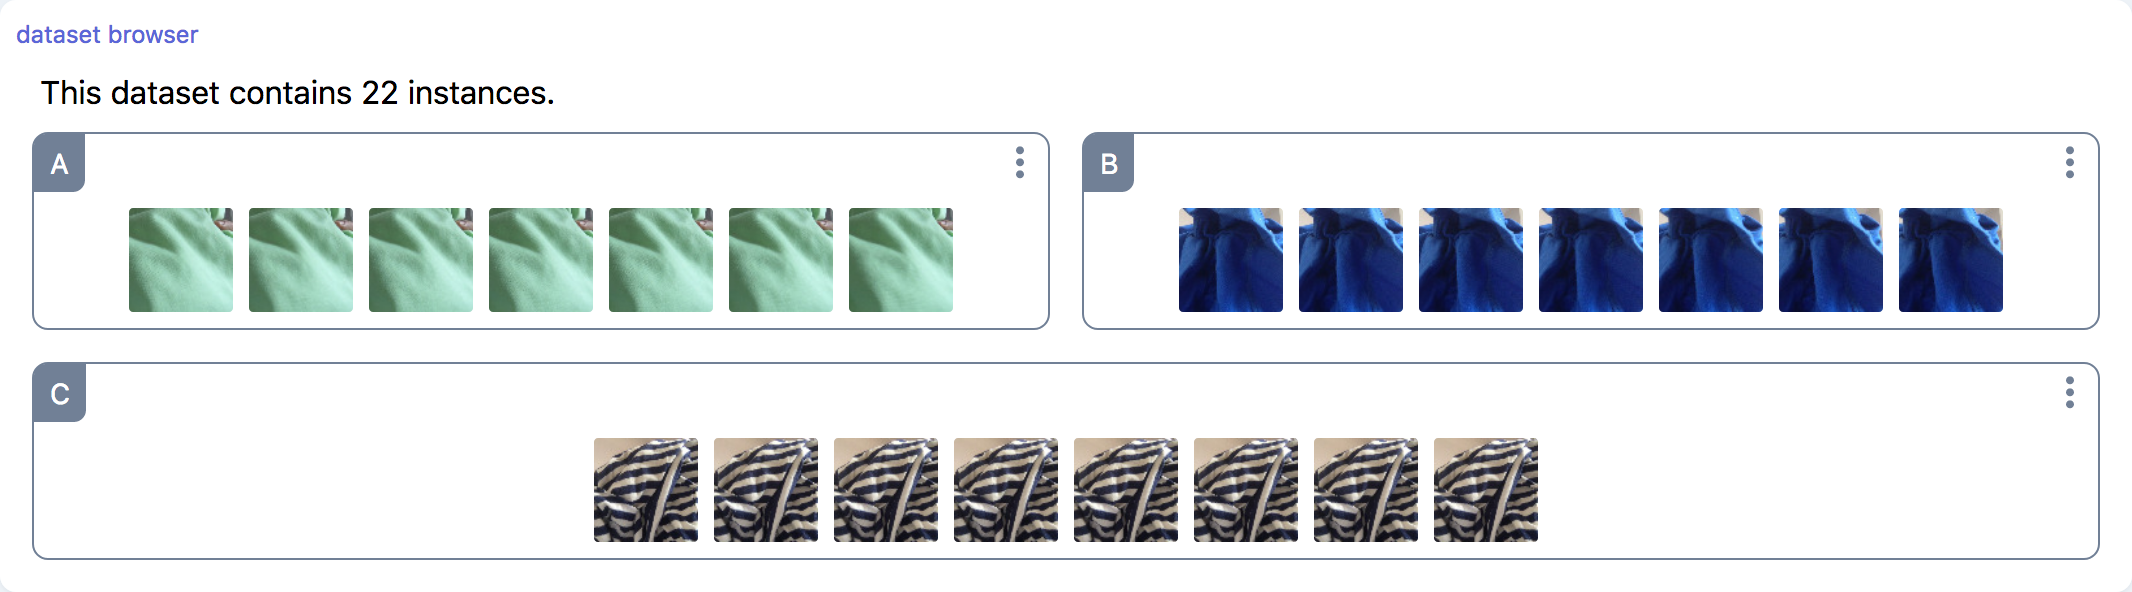
): DatasetBrowser;A Dataset browser provides an interface to visualize the contents of a dataset. It takes a dataset as argument, assuming that each instance contains a thumbnail property that can be displayed as an image (typically, a base64 dataURI).
Parameters
| Option | Type | Description | Required |
|---|---|---|---|
| dataset | Dataset | The dataset to visualize | ✓ |
| options.batchSize | number | The number of images per batch. If 0, all images are loaded. Defaults to 6. | ✓ |
Screenshot
Example
const trainingSetBrowser = marcelle.datasetBrowser(trainingSet);
dashboard.page('Data Management').use(trainingSetBrowser);datasetScatter
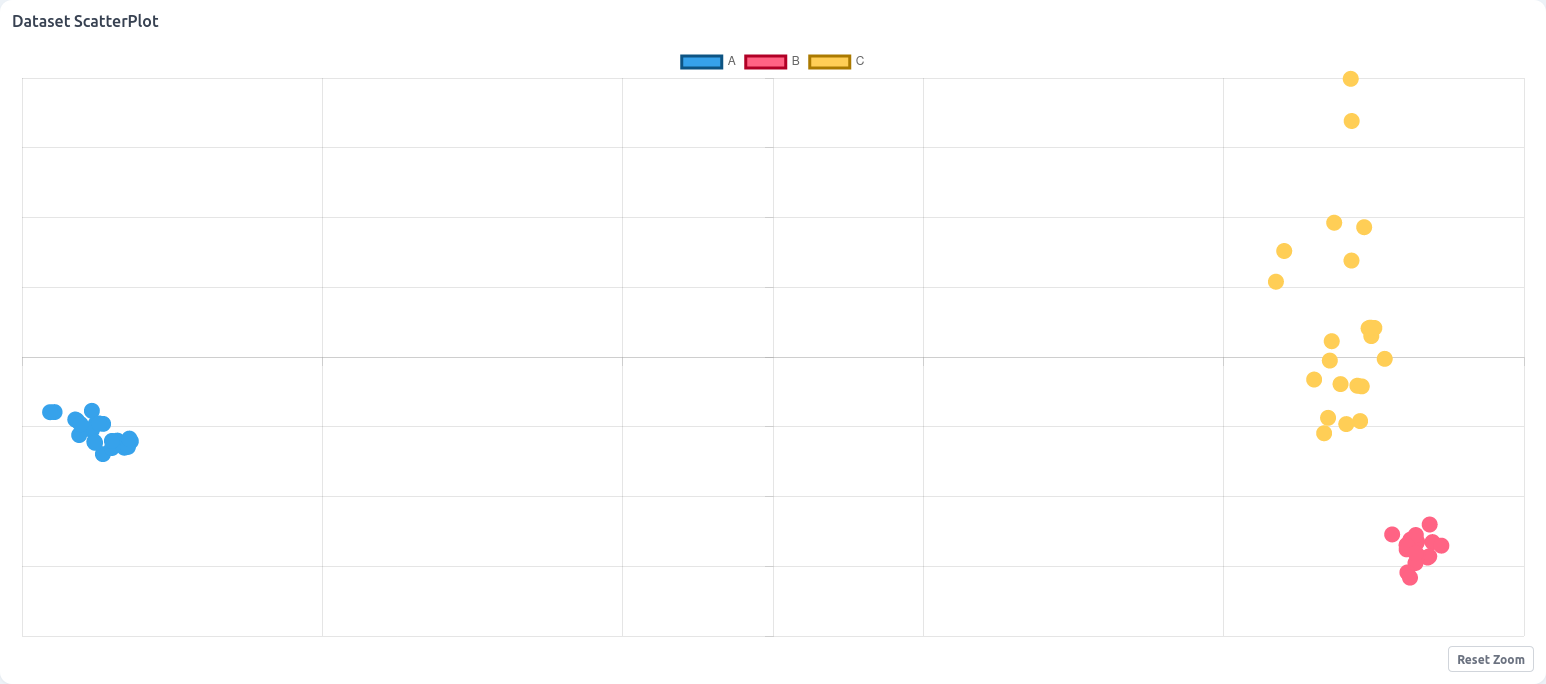
function datasetScatter<T extends Instance>(dataset: Dataset<T>): DatasetScatter<T>;Visualize the contents of a dataset using a scatter plot visualization. The mapping between the fields of dataset instances and the x, y position, as well as the label, can be specified using transformer functions.
Parameters
| Option | Type | Description | Required |
|---|---|---|---|
| dataset | Dataset - | The dataset to visualize | ✓ |
Methods
.setTransforms()
function setTransforms(t: Partial<Transforms<T>>): void;Set one or several data transformations for xy coordinates, and label. Transforms have the following signature:
interface Transforms<T extends Instance> {
  xy: (value: T) => [number, number] | Promise<[number, number]>;
  label: (value: T) => number | string | Promise<number | string>;
}Screenshot
Example
const trainingScatter = marcelle.datasetScatter(trainingSet);
dashboard.page('Data Management').use(trainingScatter);datasetTable
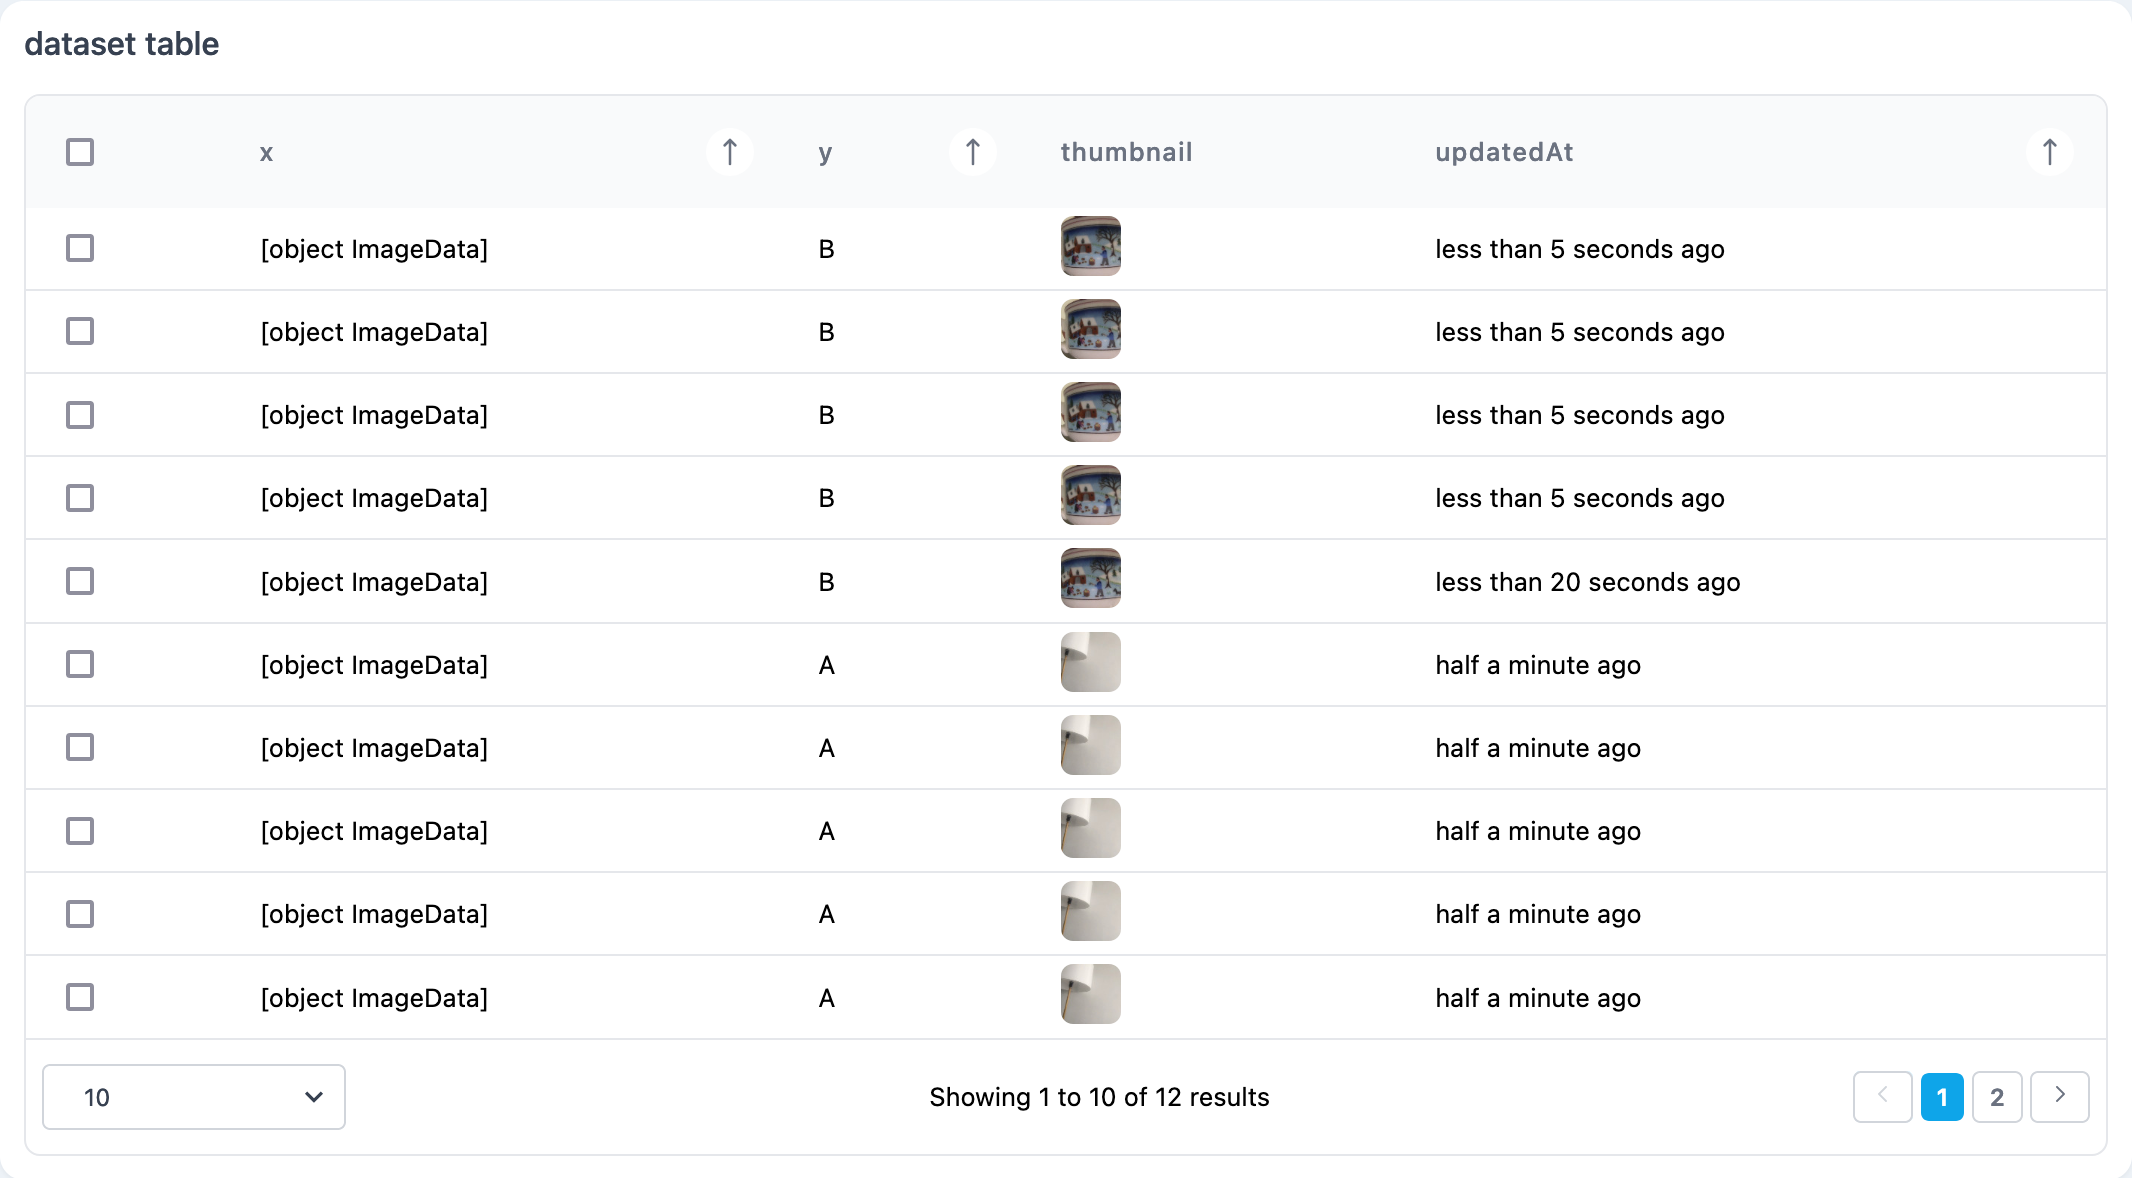
function datasetTable(dataset: Dataset, columns?: string[]): DatasetTable;This components provides a visualization of a dataset as a paginated data table, where each row describes an instance. It takes a dataset as argument, and optionally the list of columns to display.
Parameters
| Option | Type | Description | Required |
|---|---|---|---|
| dataset | Dataset | The dataset to visualize | ✓ |
| columns | string[] | The fields to display as columns in the visualization. Defaults to ['x', 'y', 'thumbnail', 'updatedAt']. |
Screenshot
Example
const tst = marcelle.datasetTable(trainingSet);
dashboard.page('Data Management').use(tst);imageDisplay
function imageDisplay(imageStream: Stream<ImageData> | Stream<ImageData[]>): DatasetBrowser;An Image Display allows for displaying an image on screen provided by an input stream.
Parameters
| Option | Type | Description | Required |
|---|---|---|---|
| imageStream | Stream<ImageData> | Stream<ImageData[]> | Stream of images of ImageData format | ✓ |
Example
const source = imageUpload({ width: 224, height: 224 });
const instanceViewer = marcelle.imageDisplay(source.$images);
dashboard.page('Data').use(instanceViewer);videoPlayer
function videoPlayer(src: string): VideoPlayer;A simple video player.
Parameters
| Option | Type | Description | Required |
|---|---|---|---|
| src | string | Video source |
Screenshot

Example
const player = videoPlayer();
player.$src.set('http://localhost:3030/assets/65533254bbcc10126bd44ad3/asset.webm');